
To make a table in Google Sheets, select your data including the header row and press Ctrl+Alt+T, or go to Format > Convert to table. Sheets turns the range into a named table (Table1) with a styled header, banded rows, and a dropdown arrow on every column.
beginner 2 min read
How to Make a Table in Google Sheets (Convert to Table)
Make a table in Google Sheets in one step with Format > Convert to table (Ctrl+Alt+T), or build a simple formatted table by hand with borders and colors.
SB
Sheets Bootcamp
September 30, 2026
Table of Contents
Quick Answer
“Make a table” means two different things in Google Sheets. There’s the Tables feature, which turns a range into a structured table in one step. And there’s the old way: a range you format to look like a table with borders and colors. This guide covers both, starting with the faster one.
How to Convert a Range to a Table
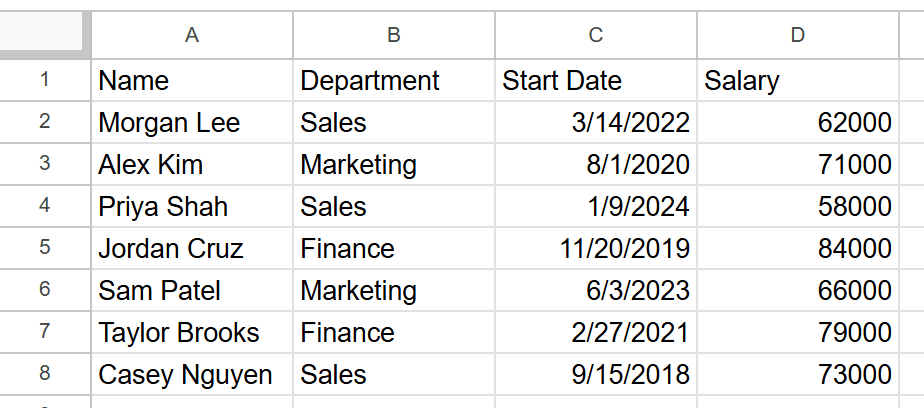
Start with a range that has one header row and one record per row. Here’s an employee list:
1
Select the data
Highlight the whole range, header row included. Here that’s A1:D8.
2
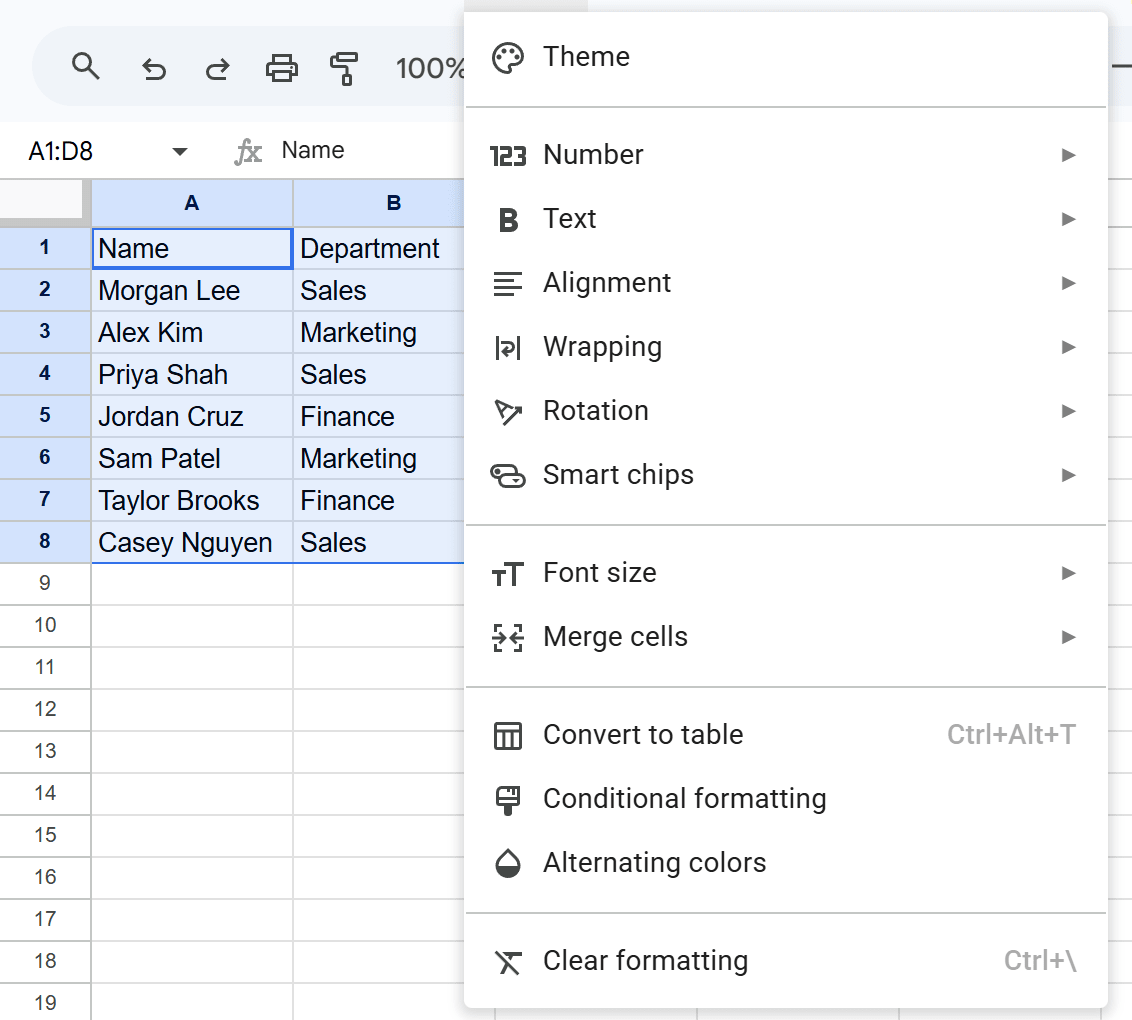
Go to Format > Convert to table
Open the Format menu and choose Convert to table. The shortcut is printed right next to it: Ctrl+Alt+T.
3
Review the result
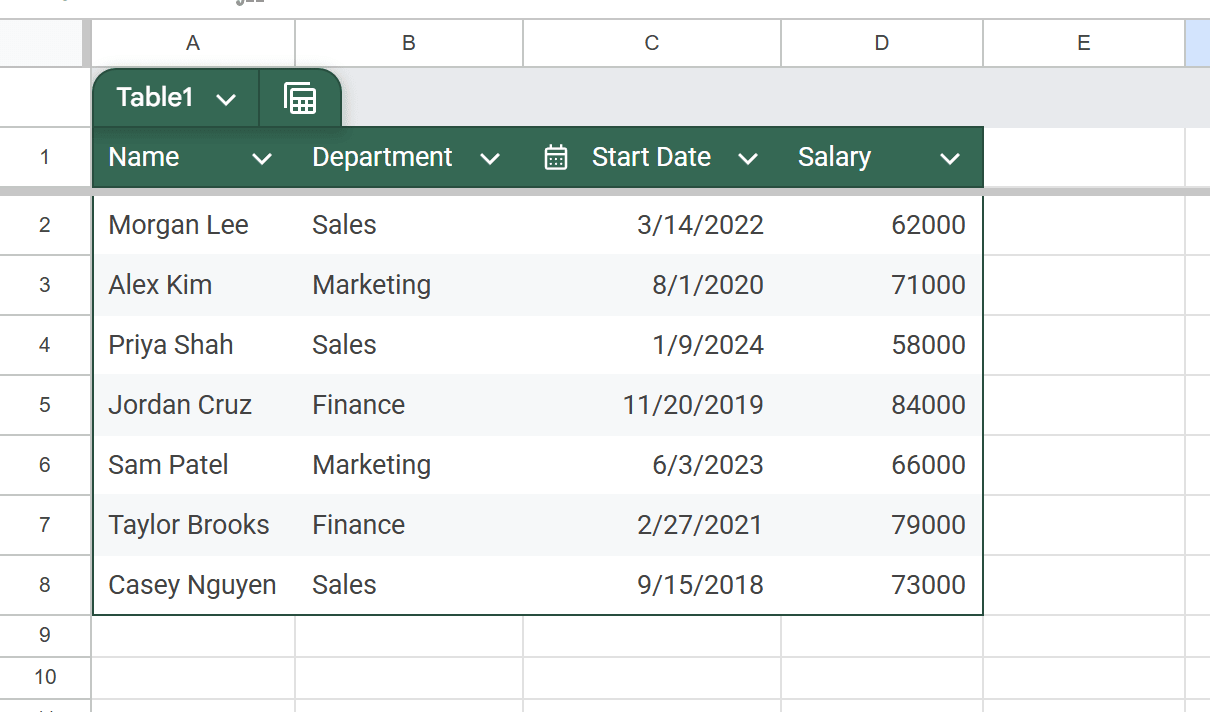
The range becomes a table called Table1. The header turns into a colored bar, rows alternate shading, and every column header gets a dropdown arrow. Sheets also guesses a type for each column: here it recognized Start Date as dates and marked it with a calendar icon.
4
Rename the table
Click Table1 on the tab above the header and give it a name that says what’s in it, like “Employees”. A descriptive name matters once a sheet has more than one table.
Note
The first time you convert a range, Sheets shows a “Change column type” tip. Column types keep a column consistent, for example dates only, or a dropdown of set choices. Set them from the arrow on each column header.
Why Use a Table Instead of a Plain Range
A table is still made of ordinary cells, so formulas like VLOOKUP and SUMIF work on it the same way. What the table adds is structure:
- A consistent look without formatting anything by hand.
- Column types, so a date column stays a date column.
- A name, so you can tell tables apart on a busy sheet.
- Header menus on every column.
If you share a sheet with people who type data into it, the column types are the big win. They’re the same idea as data validation, applied to a whole column at once.
How to Make a Simple Formatted Table by Hand
If you just want a range that looks like a table, format it yourself:
- Bold the header row. Select row 1 and press Ctrl+B.
- Add borders. Select the range, click the Borders button on the toolbar, and pick all borders.
- Stripe the rows. With the range selected, go to Format > Alternating colors and pick a style. See alternating colors for the details.
- Freeze the header. Go to View > Freeze > 1 row so the header stays visible as you scroll. See freeze rows and columns.
This version has no column types or table name, but it works everywhere and nobody needs to know about the Tables feature to edit it.
Other Ways to Start a Table
The Insert menu also has Pre-built tables and Generate a table, for when you’re starting from nothing. When your data already exists, Convert to table is the direct route.
Related Google Sheets Tutorials
- Alternating Colors - Striped rows without the Tables feature
- Freeze Rows and Columns - Keep the header on screen
- Dropdown Lists - Limit a column to set choices
- How to Sort and Alphabetize - Put the table in order
Frequently Asked Questions
How do I make a table in Google Sheets?
Select your data including the header row and press Ctrl+Alt+T, or go to Format > Convert to table. Sheets turns the range into a table named Table1 with a styled header, banded rows, and a dropdown arrow on every column header.
What is the shortcut to create a table in Google Sheets?
Ctrl+Alt+T. It's printed next to Convert to table in the Format menu.
Does converting to a table change my data?
No. In our test the values came through unchanged. Converting changes the look and adds structure, such as a column type for each column, but the numbers and text stay the same.
How do I make a simple table with borders instead?
Select the range, add borders with the Borders button on the toolbar, bold the header row, and use Format > Alternating colors for striped rows. That gives you a formatted table without the Tables feature.
Can I start from a ready-made table?
The Insert menu has Pre-built tables and Generate a table options for starting from scratch. When your data already exists, Format > Convert to table is the direct route.
You've googled this formula before. Probably more than once.
The Bootcamp is a real Google Sheet that grades every formula the moment you press Enter. 193 exercises across 9 modules, the 10% of Sheets that does 90% of the work. One payment of $29.
Get It for $29 Get the Bootcamp for $2930-day refund. Reply to any email and you get your money back.
Not ready to pay? Try Basic Training free →